
The problem
After every testing window the same spreadsheets were rebuilt by hand. The three platforms don’t share a format or even the same student identifiers; leaders received percentiles without context, and teachers received exports they had no time to read. Nobody could see a student’s reasoning ability, attainment and early reading side by side.
What it does
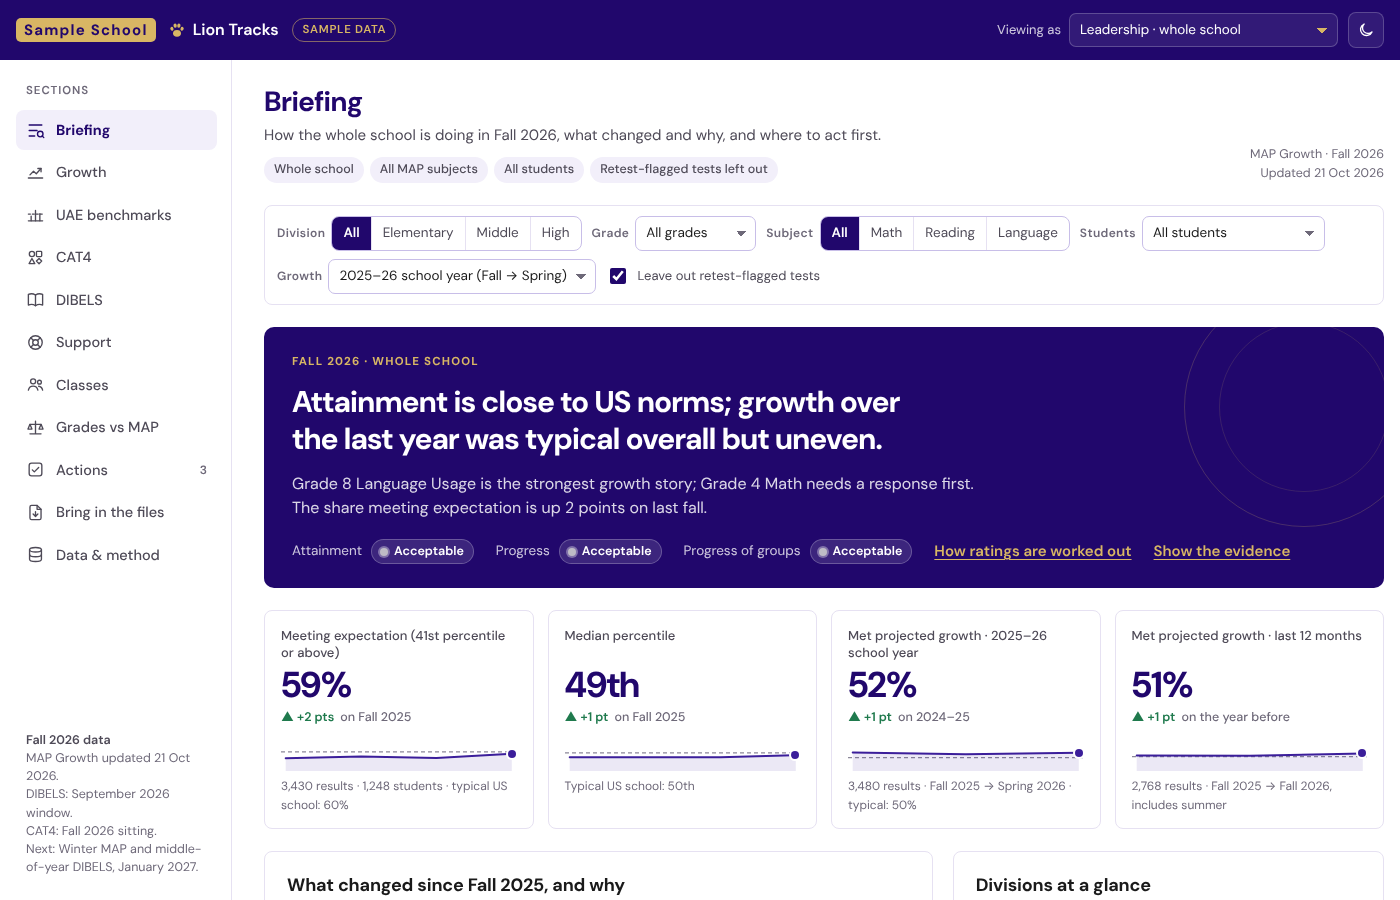
- A briefing first. A plain-language headline – what changed, why and where to act – then four figures, each with its comparison and its number of students.
- Growth by grade and class, UAE benchmarks, and Grades vs MAP to see where teachers’ grades and test results disagree.
- CAT4 reasoning profiles next to attainment: the able students not yet attaining, and those whose language may be hiding their ability.
- DIBELS benchmark levels for K–6, with who needs support, at what tier, and the actions agreed for them.
- Viewing as decides the scope: leadership sees the school, a division head their division, a teacher their own class.
The data work
Bring in the files shows the roster and the three exports as they really arrive – leading zeros, “Last, First” names, duplicates, retests, UK year groups – and reconciles them in five steps, counting every rule it uses; the few rows it can’t be sure of are left for a person, with suggested matches, rather than guessed. The same join is written out in SQL. Data & method defines every measure: what it is, how it is calculated, which file it comes from, when it refreshes and who sees it.
Every figure on the briefing can show the evidence behind it: the number, the group, the comparison and how it was worked out.
Working with people
It started as Assessment Insights, for MAP Growth alone; CAT4 and DIBELS joined in October, when it became Lion Tracks, and DIBELS covers K–6 on the assessment coordinator’s advice. Retest-flagged results are left out by default, and the page says so.
What I’d do next
Try it with division leaders on the Winter MAP results and the middle-of-year DIBELS window (January 2027), and take the files straight from the platforms’ exports instead of uploads.